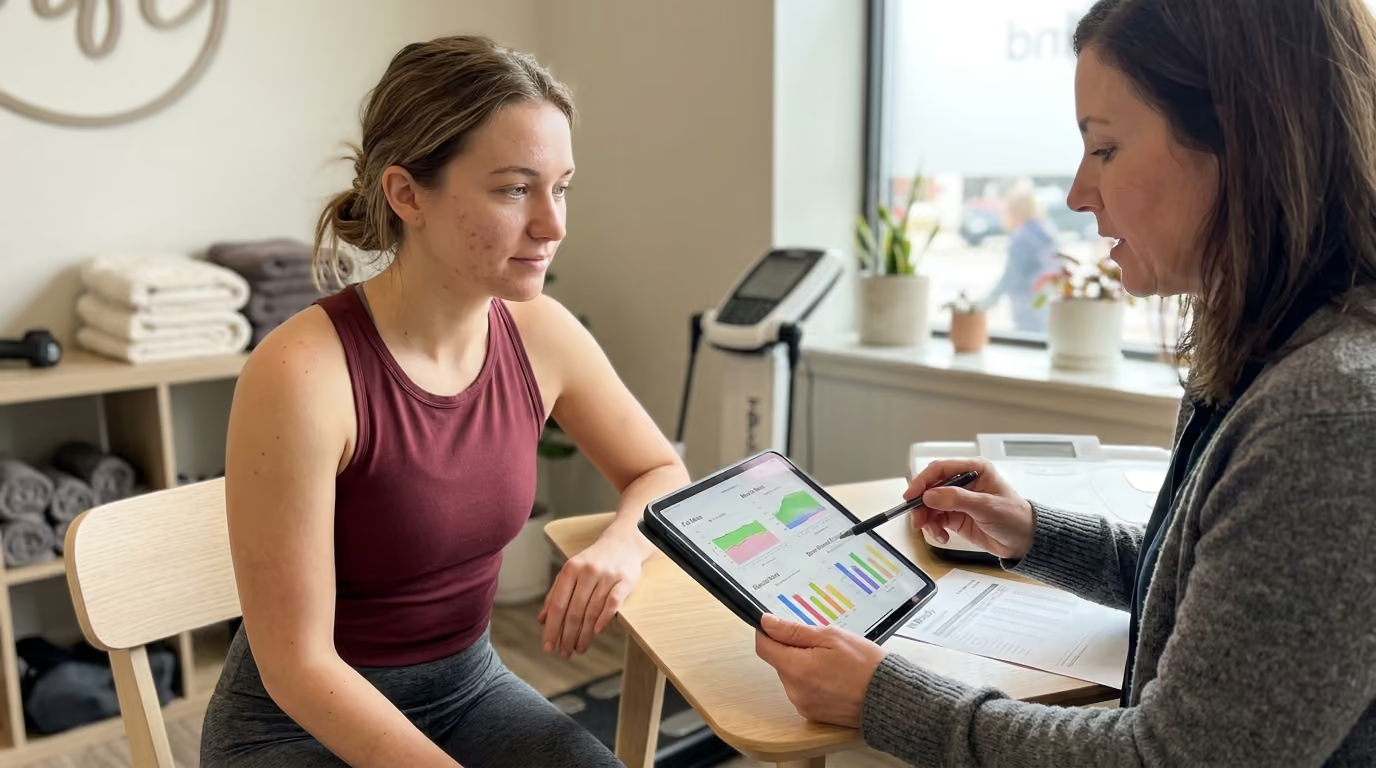

Scale weight often masks metabolic health, but multi-compartment testing models and field tools accurately distinguish fat, muscle mass, and bone density.





You step off a long-haul flight from Zurich, check into your hotel, and step onto a bathroom scale. The number shows you have gained two kilograms overnight. A few days later, after several hard days of hiking in the mountains, your home bioimpedance scale claims your body fat went up while your muscle mass dropped.
Situations like this create needless confusion. The human body is dynamic, and consumer tools often mistake basic fluid shifts for true tissue change. Understanding what your body is made of requires looking past simple digital readouts.
True body composition assessment is not a direct anatomical dissection. Every commercial and clinical tool relies on mathematical models, physical proxies, and biological assumptions. When you learn how these tools work, where they fail, and how to control testing conditions, you can track meaningful changes in fat, muscle, and bone with complete clarity.
Body composition describes how your total mass is divided across distinct biological components. These compartments include adipose tissue, skeletal muscle, water, connective organs, and mineralized bone.
No single testing method is perfect for every situation. Total body weight reflects everything at once, from skeletal mass to your last glass of water. Advanced methods like dual-energy X-ray absorptiometry estimate bone, fat, and lean soft tissue using X-ray attenuation. Bioelectrical impedance measures electrical resistance across fluid pathways.
The primary rule of body composition assessment is method consistency. A moderately accurate tool used under repeatable conditions provides far more practical value than a laboratory scan performed haphazardly.
For active adults, the goal of testing is rarely to find an exact, unquestionable percentage. Instead, the objective is to monitor directional trends over months and years. This data ensures that your training, nutrition, and lifestyle preserve functional muscle and bone density while keeping visceral fat within a healthy range.
To understand any testing technology, you must understand the biological models researchers use to divide the human body. Scientists categorize body mass into multi-compartment frameworks depending on the depth of analysis required.
The simplest approach is the two-compartment model. This framework divides your total weight into fat mass and fat-free mass.
Fat mass consists of all extractable lipids from adipose tissue and other organs. Fat-free mass includes everything else, such as water, muscle tissue, internal organs, and bone minerals.
The major weakness of this model is its assumption that fat-free mass has a constant density and hydration level. In reality, hydration levels fluctuate continuously throughout the day. Bone mineral density also varies widely between individuals based on age, genetics, and activity levels. Caliper testing and underwater weighing rely primarily on variations of this two-compartment assumption.
More sophisticated clinical methods expand this view into three or four separate compartments. A three-compartment model typically separates total mass into total body water, fat mass, and fat-free dry mass.
Dual-energy X-ray absorptiometry uses a different three-compartment approach. It separates mass into fat mass, lean soft tissue, and bone mineral content. This distinction is critical for active adults managing long-term physical capacity, as bone density directly affects injury resistance.
The four-compartment model represents the standard in clinical research. It measures body density, total body water, and bone mineral content using separate reference tools. These inputs are combined to calculate fat mass with minimal biological assumptions.
Because four-compartment testing requires multiple laboratory devices, it remains impractical for routine tracking. Commercial methods serve as accessible proxies for these rigorous multi-compartment systems.
A common point of confusion is the difference between lean soft tissue and actual skeletal muscle. When a DXA scan or bioimpedance scale reports your lean mass, it is not measuring pure contractile muscle.
Lean soft tissue includes all water-containing, non-fat structures. This includes your liver, kidneys, heart, skin, blood volume, and the glycogen stored inside your cells. Skeletal muscle typically accounts for only a portion of your total reported lean mass.
When your hydration levels rise, or when your muscles store extra glycogen and water after carbohydrate consumption, your reported lean mass increases immediately. That change does not represent new muscle protein synthesis. True muscle hypertrophy occurs slowly over weeks of consistent resistance training, whereas lean mass readouts can swing within hours based on fluid balance.
Not all body fat carries the same physiological significance. Subcutaneous fat sits directly beneath the skin. It acts as an energy reservoir and provides thermal insulation without directly threatening metabolic function.
Visceral adipose tissue surrounds your internal abdominal organs. Elevated visceral fat correlates strongly with systemic inflammation, insulin resistance, and cardiovascular strain.
Basic tools like skinfold calipers only sample subcutaneous tissue. Advanced imaging tools like magnetic resonance imaging and computed tomography directly visualize visceral deposits. Understanding which compartment a device measures helps you interpret your results accurately.
You do not always need sophisticated technology to gather meaningful data. Simple, low-cost tools remain exceptionally useful when interpreted through the correct lens.
A standard scale measures total gravitational pull on your body mass. It cannot tell the difference between a kilogram of adipose tissue, a kilogram of water, or a kilogram of skeletal bone.
Body weight is highly sensitive to short-term biological noise. Shifts in dietary sodium, carbohydrate intake, bowel contents, and muscular inflammation from hard training all alter scale weight overnight.
Despite these limitations, weight remains a valuable metric. It provides a fast, zero-cost signal of energy balance when tracked as a multi-day rolling average. When combined with other measurements, it helps confirm whether tissue changes are occurring.
Body mass index compares total weight to height squared. It was designed as a population-level screening metric for epidemiological research rather than an individual diagnostic tool.
The fundamental flaw of BMI is its inability to differentiate tissue types. An athletic adult with substantial skeletal muscle and low body fat can easily register as overweight or obese.
Conversely, an older individual with low muscle mass and elevated visceral fat may register as normal. BMI provides general context, but active adults require more specific tissue metrics.
Waist circumference serves as an inexpensive proxy for abdominal and visceral adiposity. Measuring your waist tracks changes in central fat distribution more effectively than scale weight alone.
Consensus guidelines from organizations such as the American Diabetes Association highlight specific cardiometabolic risk thresholds. For individuals of European ancestry, a waist circumference above 102 centimeters in men and 88 centimeters in women indicates increased metabolic risk.
Lower thresholds apply to individuals of South Asian, Japanese, and Chinese ancestry. In these populations, risk thresholds typically begin around 90 centimeters for men and 80 centimeters for women.
Measurement technique must be strictly standardized to yield reliable trends. Stand upright with your feet together, relax your abdominal wall, and measure at the end of a normal exhalation.
The measuring tape should remain horizontal and snug against the skin without compressing soft tissue. The National Institutes of Health recommends measuring at the superior border of the iliac crest. The World Health Organization protocol uses the midpoint between the lower rib margin and the top of the iliac crest. Either anatomical landmark works well, provided you use the exact same location every time.
Dividing your waist circumference by your height creates a normalized metric that accounts for stature. A waist-to-height ratio below 0.5 is broadly recognized as a healthy target for adults across diverse populations.
This ratio provides a straightforward baseline that requires only a tape measure. It provides immediate insight into whether central fat accumulation is outpacing your physical frame.
Field assessment tools balance accessibility with deeper tissue insights. They can be performed in fitness facilities, sports clinics, or at home, but each has distinct operational challenges.
Skinfold calipers measure the double fold of skin and subcutaneous adipose tissue at designated anatomical sites. Common protocols evaluate three, four, or seven sites across the body, including the triceps, chest, abdomen, suprailiac crest, and thigh.
These raw millimeter values are entered into mathematical regression equations to estimate body density and total body fat percentage. Calipers do not measure visceral fat or total fat directly; they sample accessible subcutaneous layers.
The greatest advantage of skinfolds is their relative immunity to daily hydration shifts compared to electrical methods. When performed correctly, calipers offer exceptional repeatability for tracking localized tissue changes.
However, skinfold testing is highly operator-dependent. A novice tester can make substantial errors when locating anatomical landmarks, grasping the fold, or reading the gauge.
Studies comparing novice and expert testers show that inexperienced practitioners frequently exceed acceptable error limits. Novice measurement errors can be two to four times higher than those of seasoned clinicians.
Calipers also lose utility in individuals carrying substantial body mass. When skinfolds become too thick or dense to isolate cleanly, measurement error increases rapidly.
To maximize the value of skinfolds:
Bioelectrical impedance analysis passes an imperceptible, low-level alternating electrical current through the body. The device measures the resistance and reactance of tissues to this current.
Water-rich tissues like skeletal muscle contain electrolytes and conduct electrical current easily. Adipose tissue and bone contain far less water and resist electrical flow.
The device takes your measured electrical impedance and combines it with your height, weight, age, and sex. It then uses proprietary mathematical algorithms to calculate total body water, fat-free mass, and body fat percentage.
Consumer smart scales typically pass electrical currents between foot electrodes. Advanced clinical devices incorporate hand electrodes and utilize multiple electrical frequencies. Multifrequency systems can differentiate between intracellular water inside cells and extracellular water in bloodstream and interstitial spaces.
The fundamental challenge with BIA is that it never observes fat directly. It measures electrical conductivity and infers your body composition based on expected hydration ratios.
Any factor that alters your fluid distribution or skin conductance immediately alters the reported body fat percentage. Research from the European Society for Clinical Nutrition and Metabolism identifies several key variables that distort BIA readings:
Clinical validation studies demonstrate that consumer smart scales can track body weight accurately, but their body fat estimates often show substantial individual variation. A study examining multifrequency impedance against reference scans found average offsets of several percentage points in body fat.
BIA is best utilized as a long-term trend tool rather than an absolute measurement. Pick a single device, test under identical conditions, and focus entirely on multi-week rolling averages.
When you require detailed regional data, bone mineral metrics, or clinical diagnostics, laboratory technologies become relevant.
DXA utilizes an X-ray source that emits beams at two distinct energy peaks. As the beams pass through your tissues, dense bone mineral and soft tissues attenuate the X-ray photons at different rates.
A detector measures this differential absorption, allowing the system software to separate bone mineral from soft tissue. The soft tissue is further mathematically divided into fat mass and lean soft tissue.
A complete DXA scan provides comprehensive data:
DXA is widely treated as a clinical reference method because it is fast, comfortable, and exposes you to minimal radiation. However, DXA is not a chemical dissection.
Positioning variations, recent fluid intake, scanner calibration, and movement can introduce technical error. If you are tracking changes in muscular development through strength and physical performance testing, DXA offers exceptional regional insight when properly controlled.
Air-displacement plethysmography, commonly known by the trade name BOD POD, evaluates body volume rather than X-ray absorption. The subject sits inside a sealed fiberglass chamber while computer sensors measure changes in air pressure.
By calculating the volume of air displaced by your body, the system determines your physical body volume. Combining your body volume with your scale weight yields total body density.
The system then applies established mathematical formulas to convert whole-body density into estimated fat mass and fat-free mass. The test is completely non-invasive and avoids radiation exposure.
However, BOD POD measurements are sensitive to external physical variables. Body hair, moisture on the skin, tight clothing, and internal body heat can alter air pressure dynamics inside the chamber.
Participants must wear specialized tight-fitting swimwear and a compression cap to minimize trapped air. Like underwater weighing, the BOD POD assumes standard densities for lean tissue, which can introduce error across diverse ages and ethnicities.
Historically considered the reference standard of body composition testing, hydrostatic weighing calculates body density through water displacement. The subject is submerged underwater on a specialized scale after exhaling all air from their lungs.
Because fat tissue is less dense than water, an individual with higher body fat weighs proportionally less underwater than a muscular individual of identical scale weight. Residual lung volume must be measured or estimated, as trapped air in the respiratory tract increases buoyancy.
While scientifically sound, hydrostatic weighing is physically demanding and uncomfortable. Forcing a complete exhalation while submerged underwater requires practice and composure.
Because of its operational complexity, hydrostatic weighing has largely been superseded in modern sports clinics by DXA and advanced imaging.
MRI and CT represent the true reference standard for visualizing internal soft tissue architecture. These imaging tools capture high-resolution cross-sectional slices of specific anatomical regions.
MRI uses powerful magnetic fields and radiofrequency pulses to create detailed images of muscle tissue and fat depots. It can quantify total muscle volume, regional subcutaneous fat, visceral adipose tissue, and intramuscular fat infiltration without ionizing radiation.
CT utilizes X-rays to measure tissue attenuation, providing clear differentiation between lean muscle, visceral fat, and subcutaneous tissue. CT is particularly valuable for measuring muscle density; lower attenuation values in muscle tissue reflect higher lipid infiltration, signaling reduced muscle quality.
The primary limitations of MRI are high financial cost, limited availability, and lengthy scan times. CT scans involve meaningful doses of ionizing radiation, making them unsuitable for routine wellness tracking.
CT data is often gathered opportunistically when an active adult undergoes medical imaging for unrelated clinical reasons. When combined with comprehensive longevity and biohacking assessments, imaging delivers unmatched precision regarding internal tissue quality.
Every measurement method carries inherent uncertainty. Interpreting your data correctly requires understanding the difference between technical noise and true biological adaptation.
Accuracy describes how closely a measured number reflects your true physical value. Because true tissue mass can only be confirmed through direct post-mortem chemical analysis, living accuracy is always an estimate compared to a reference model.
Precision, or repeatability, describes how closely repeated measurements match one another when performed on the same person under identical conditions. A device can be exceptionally precise while remaining systematically inaccurate.
For example, a home smart scale might consistently report your body fat as 14% across ten consecutive days, providing high precision. However, if a four-compartment laboratory scan reveals your actual fat mass is 18%, that scale suffers from a systematic offset.
For personal health tracking, high precision is often more important than absolute accuracy. A precise tool reliably detects whether your tissue mass is moving up or down over time.
Before you conclude that a new diet or training block has altered your body composition, you must understand the Least Significant Change. The International Society for Clinical Densitometry emphasizes that every clinical facility and testing device has an inherent measurement error margin.
The Least Significant Change is the minimum numerical difference required between two scans before you can be mathematically confident that real biological change occurred. It is calculated from the precision error of the specific device and the technician operating it.
Consider a practical example with a DXA scan:
Understanding this principle protects you from making reactionary changes to your diet or training program based on simple measurement noise.
To provide practical context, clinical literature identifies typical body fat percentage error ranges for major testing modalities when conducted under standard conditions:
These error ranges reflect the reality of biological modeling. They demonstrate why tracking multi-week trends is essential for meaningful insight.
Observing how these testing dynamics operate in real life helps prevent misinterpretation.
An active executive begins a structured low-carbohydrate nutrition program. Within the first ten days, their bathroom scale drops by 3.5 kilograms.
Excited by the progress, they step onto a commercial BIA scale at their fitness club. The machine reports that they lost 2.5 kilograms of lean mass and only 1.0 kilogram of body fat. The individual panics, assuming their calorie restriction is destroying their skeletal muscle.
This panic is entirely unfounded. Each gram of stored glycogen in your muscle tissue binds approximately three to four grams of water.
When you restrict carbohydrates, your body burns through stored glycogen, releasing bound water through the kidneys. Because bioelectrical impedance calculates lean mass based on total body water, the sudden fluid loss appears as lost lean mass on the digital readout.
The individual did not lose 2.5 kilograms of contractile muscle protein in ten days. They simply cleared stored glycogen and water. Standardizing nutrition and checking measurements over a six-week window provides the true trajectory.
A dedicated hiker commits to a progressive resistance training program three days per week while maintaining their regular caloric intake. After three months of consistent training, they step on the bathroom scale and find their total body weight is completely unchanged.
Frustrated by the apparent lack of progress, they measure their waist circumference and review their training logs. Their waist measurement has decreased by 4.5 centimeters, their clothing fits loosely through the midsection, and their deadlift strength has increased by twenty kilograms.
This is a classic presentation of body recomposition. The individual lost abdominal fat while simultaneously adding dense skeletal muscle tissue and glycogen storage capacity.
Because muscle is denser than adipose tissue, their overall physical volume shrank while total scale mass remained flat. Waist circumference and functional performance confirmed the success that the standard scale obscured.
A recreational runner completes a multi-frequency BIA test at their wellness clinic on a Tuesday morning, which reports their body fat at 16.2%. On Thursday afternoon, they step onto a consumer smart scale at home, which registers their body fat at 22.8%.
The runner wonders which machine is broken. In reality, neither device is malfunctioning.
The two machines use different electrode configurations, different electrical frequencies, and completely different proprietary mathematical equations. Furthermore, the tests were conducted at different times of day under different hydration and nutritional states.
Comparing raw numbers between two different devices is mathematically invalid. The correct strategy is to select one reputable device, establish strict testing protocols, and track the direction of that single device over time.
A competitive master's rower stands 180 centimeters tall and weighs 92 kilograms, giving him a BMI of 28.4. Standard public health classifications label him as significantly overweight.
However, his waist circumference measures 81 centimeters, yielding a waist-to-height ratio of 0.45. His DXA scan confirms an overall body fat percentage of 12%, with exceptionally high appendicular lean mass and dense bone mineral scores.
Relying exclusively on BMI would incorrectly flag this individual for cardiometabolic intervention. Combining waist measurements, functional capacity, and clinical scanning reveals high physiological fitness.
A 68-year-old retired professional maintains a stable body weight of 65 kilograms, which has remained unchanged for fifteen years. Her BMI falls comfortably within the normal range.
Despite stable weight, she notices increasing fatigue when carrying luggage, reduced walking speed, and difficulty rising from deep chairs. A clinical DXA scan reveals significant age-related muscle loss, known as sarcopenia, paired with an increase in visceral fat deposits.
Her total body weight remained stable because accumulating adipose tissue masked the progressive loss of functional skeletal muscle. Incorporating regular strength testing and body composition scans ensures that strategies for healthy aging and living well focus on preserving lean mass rather than simply maintaining a static scale number.
Misconceptions regarding body composition data often lead active adults to chase meaningless metrics. Clarifying these points saves time and mental energy.
Consumer devices display body fat percentages with decimal-point precision, such as 18.4%. This gives the false impression of laboratory certainty.
A digital readout is merely the final output of a predictive equation based on biological assumptions. True composition is an estimated range, not an unshakeable mathematical point.
As established, lean soft tissue includes water, organs, blood, and glycogen. Gaining two kilograms of lean mass on a scan after a high-carbohydrate weekend does not mean you built two kilograms of muscle tissue.
True muscle protein synthesis is an energetically demanding biological process that occurs over months of progressive physical loading and adequate protein intake.
Many consumer smart scales now report a specific visceral fat score. These numbers are generated from statistical regression formulas combining your weight, electrical impedance, and age.
They do not visualize internal abdominal depots. To accurately assess visceral fat, you need clinical DXA scans, MRI, or targeted cross-sectional imaging.
Sarcopenia is not defined solely by a low muscle mass number on a scan. Clinical definitions require documented reductions in muscle strength and physical performance alongside reduced muscle quantity.
A muscular assessment must always be paired with functional tests, such as grip strength, chair-stand performance, and gait speed.
Scanning your body every week creates unnecessary anxiety over minor technical noise. Skeletal tissue, bone mineral density, and true muscle mass change gradually.
Testing too frequently causes individuals to mistake normal biological fluid fluctuations for training success or failure. Match your testing cadence to the speed of human biology.
You do not need an exhaustive array of testing devices to maintain an effective monitoring dashboard. A streamlined, tiered strategy provides maximum clarity with minimal lifestyle friction.
The foundation of your monitoring dashboard relies on zero-cost, highly accessible metrics.
If your weekly average weight is stable, your waist circumference is decreasing, and your lifting performance is improving, you are successfully improving body composition.
If you own a reliable BIA smart scale or have access to a qualified skinfold practitioner, use them on a monthly schedule.
For long-term health maintenance and structural preservation, schedule formal clinical assessments periodically.
This three-tiered approach provides all the actionable data you need to adjust training and nutrition without obsessing over daily numbers.
For worldly adults engaged in international trekking, skiing, and active travel, physical capability is the ultimate objective of body composition tracking. Preparing for demanding environments requires understanding how travel alters physical metrics.
Long-haul flights, altitude exposure, and shifts in dietary sodium during international travel cause acute fluid retention. Sitting in a pressurized airplane cabin for ten hours alters capillary fluid filtration, often leading to temporary lower-limb edema.
If you step on a bioimpedance scale immediately after arriving at an international destination, the device will register abnormal impedance values. The fluid accumulation in your legs will artificially distort the reported ratio of extracellular to intracellular water.
Never perform body composition testing within forty-eight hours of international air travel. Allow your hydration, electrolyte balance, and lymphatic circulation to normalize before gathering data. Integrating proper recovery and sleep protocols after arrival accelerates this normalization process.
When preparing for extended adventures, such as high-altitude trekking in the Andes or multi-day ski touring in the Alps, body composition directly affects your energy expenditure and structural resilience.
Carrying excessive non-functional fat mass increases the energetic cost of ascending steep terrain and places unnecessary stress on joints. Conversely, carrying sufficient skeletal muscle mass provides the power and glycogen storage capacity necessary to sustain consecutive high-output days.
During extended expeditions, maintaining muscle tissue becomes challenging due to elevated caloric expenditure and hypoxia-induced appetite suppression. Tracking functional performance metrics, such as loaded pack-carry capacity and uphill pace, ensures that your physical capacity remains high.
When preparing for demanding travel and adventure itineraries, your body composition strategy should prioritize robust bone mineral density and functional leg power over extreme leanness.
The broader scientific and clinical community agrees on several core principles regarding body composition assessment:
Maintaining an active, capable body requires focusing on actionable trends rather than digital noise. By using the right tool for the right question, standardizing your testing environment, and focusing on long-term physical performance, you can navigate your health data with confidence and clarity.
Return to this guide whenever you change your primary testing tool, prepare for a formal clinical DXA scan, or notice confusing short-term fluctuations on your home scale. It will help you recalibrate your testing protocols, interpret your results without unnecessary concern, and keep your attention focused on long-term functional capacity.
Consistent habits, progressive training, and repeatable measurements will always serve you better than chasing daily digital precision.
Stay connected for research and practical guidance on longevity, strength, recovery, energy and active living. New ideas to help you stay capable, curious and ready for more.


Explore practical guidance on strength, recovery, energy, travel and longevity for a life that stays active.
explore the Blog