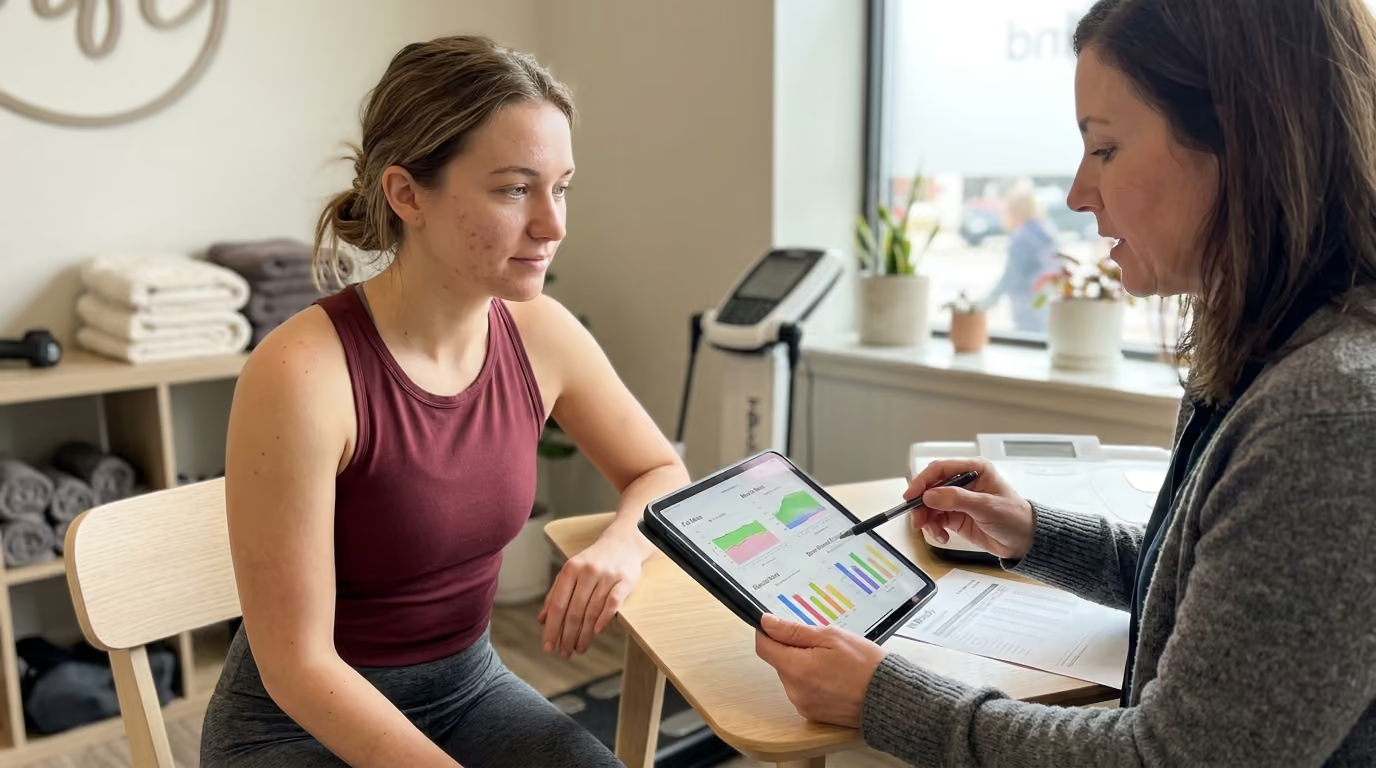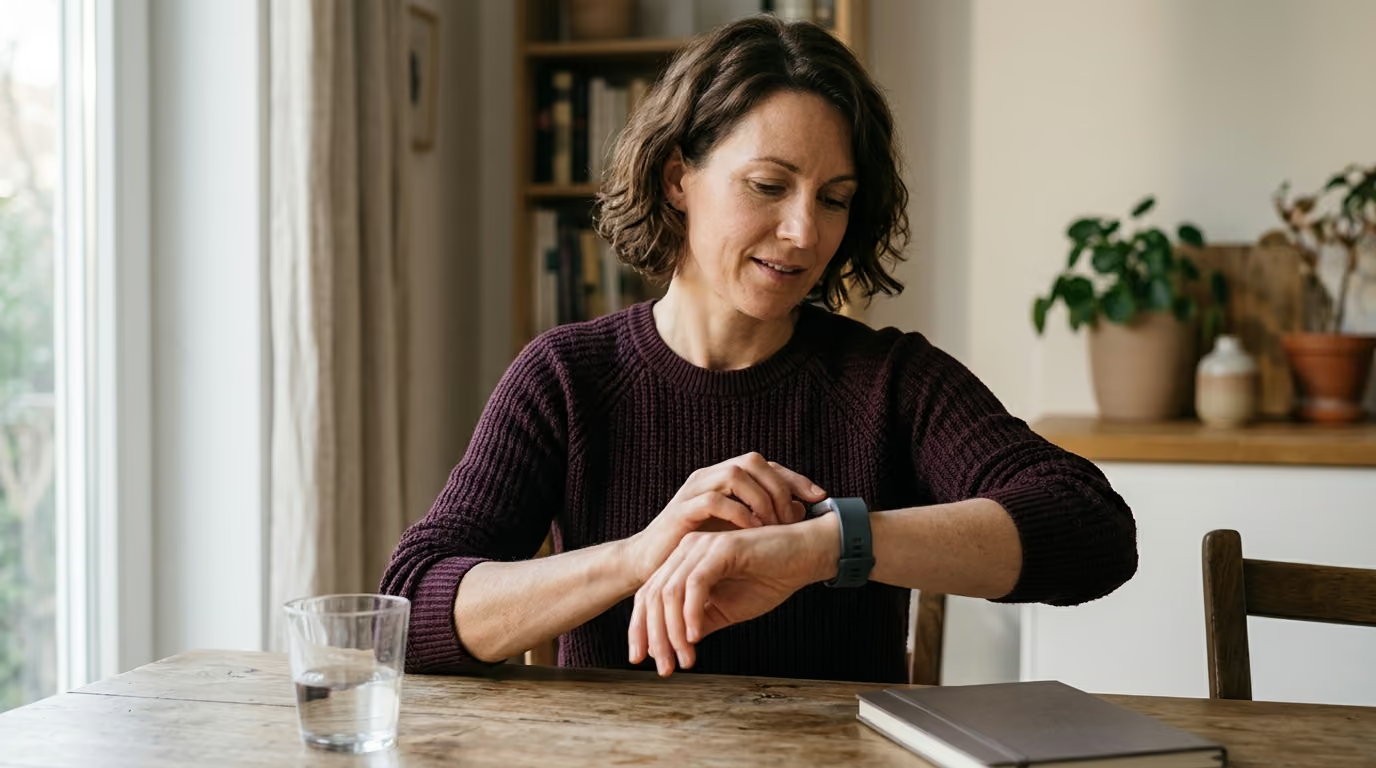

Fitness trackers seem like clinical tools, but their recovery metrics work best as personal baseline trends rather than absolute physiological diagnoses.





Most people assume that their high-end fitness tracker operates like a clinical medical monitor. They wake up, check an arbitrary readiness score, and let an algorithm decide how capable they feel. If the score is red, they cancel their morning run. If the score is green, they push through deep joint fatigue.
This approach turns useful technology into an anxious distraction. Consumer wearables do not measure your underlying biology directly. Instead, they use optical sensors, movement counters, and proprietary formulas to estimate physiological trends. Treating these estimates as clinical diagnoses creates confusion, especially for active adults managing intense schedules, mountain treks, or regular gym sessions.
To gain genuine value from a wearable, you must understand how these tools work. You must learn which numbers matter, which metrics are noisy estimates, and how to combine data with your real-world symptoms.
The central premise of wearable tracking is straightforward. Wearables are trend-monitoring tools, not diagnostic instruments. A consumer device estimates physiological variables through photoplethysmography (PPG) and motion sensors. The metric displayed on your screen is a mathematical model rather than a direct laboratory readout.
The true value of wearable technology lies in identifying persistent shifts from your established personal baseline. When you notice a multi-day departure from your normal numbers, you combine that observation with your training history, sleep environment, and physical symptoms. A single abnormal score is weak evidence on its own. A multi-day pattern across several metrics offers actionable guidance.
Framing wearable data as decision-support signals protects you from overreacting. For instance, an elevated resting heart rate can stem from poor sleep, work stress, travel fatigue, dehydration, heat exposure, alcohol intake, or acute training strain. The sensor detects the cardiovascular change, but it cannot identify the root cause.
To evaluate your daily numbers without confusion, use a clear five-step hierarchy:
Using this hierarchy keeps technology in its proper place. Your device provides helpful clues, but your personal context determines the appropriate response.
Every modern health tracker monitors a handful of primary metrics. Understanding the biological mechanisms behind these numbers allows you to separate real physiological changes from device noise.
Heart-rate variability (HRV) measures the variation in time between consecutive heartbeats. While your resting pulse describes the average number of beats per minute, HRV captures the microsecond variations between those beats. Even when your pulse is sixty beats per minute, the time between individual beats fluctuates continuously.
These beat-to-beat fluctuations reflect the balance of your autonomic nervous system. The autonomic nervous system consists of two branches: the sympathetic branch, which drives your fight-or-flight response, and the parasympathetic branch, which manages rest and digestion. When parasympathetic activity is dominant, the intervals between heartbeats become more irregular, producing a higher HRV. When sympathetic tone rises due to physiological stress, beat timing becomes more rigid, lowering your HRV.
Clinical research typically measures beat-to-beat intervals with an electrocardiogram (ECG). Consumer wearables estimate these intervals optically by shining light into the skin to detect blood volume changes. The classic standards established by the European Society of Cardiology and the North American Society of Pacing and Electrophysiology define several ways to analyze this data:
Consumer devices convert these raw numbers into proprietary readiness scores. A systematic review published in JMIR mHealth and uHealth analyzed 23 studies comparing wearable HRV to ECG standards. The researchers found a small average discrepancy between devices and ECGs, but noted high heterogeneity across individual studies. Agreement is highest during stationary sleep and drops during movement or exercise.
HRV is strictly an individual trend. An HRV value that represents peak recovery for one person might indicate severe fatigue for someone else. You cannot compare your raw score to your training partner or a published average.
Resting heart rate (RHR) is the number of times your heart beats per minute during periods of complete physical rest. Consumer devices capture this metric while you sleep or during quiet morning periods.
At rest, optical sensors perform reliably. A review in Nature Medicine found that PPG-based wearables measure resting pulse with a mean absolute error of roughly two beats per minute. In controlled environments, wrist-worn devices exhibit an error margin of approximately three percent when compared to clinical monitors.
Resting heart rate changes in response to several factors, including:
Large epidemiological studies associate higher resting heart rates with greater long-term cardiovascular risks. Meta-analyses in the American Journal of Hypertension and the Canadian Medical Association Journal indicate that each ten-beat increase in baseline pulse correlates with higher mortality risk across broad populations.
However, these population-level associations do not turn your wearable into a clinical risk calculator. A temporary spike in your resting heart rate does not indicate disease. It simply tells you that your cardiovascular system is processing an acute physical or environmental load.
Wearable devices estimate sleep metrics by combining accelerometer movement data with optical pulse readings. Typical sleep summaries report several standard values:
Clinical sleep laboratories evaluate sleep using polysomnography (PSG). Polysomnography records brain waves, eye movements, muscle tone, and breathing patterns. Consumer wearables lack brain-wave sensors. They infer sleep stages based entirely on wrist movement, heart rate fluctuations, and skin temperature.
Because of these hardware limitations, wearable sleep tracking is far better at detecting sleep than identifying wakefulness. A validation study in Sleep Medicine evaluated several commercial devices against laboratory polysomnography. While all devices demonstrated greater than 95 percent sensitivity for detecting sleep, their sensitivity for classifying specific sleep stages ranged between 50 and 86 percent.
A study comparing WHOOP, Fitbit, and Garmin against laboratory PSG found moderate disagreement for specific sleep phases. WHOOP performed reasonably well for total sleep time and deep sleep, but showed an average discrepancy of 21 minutes for REM sleep. Broad reviews indicate that commercial devices achieve only moderate agreement with clinical sleep staging.
You should focus primarily on total sleep duration and sleep consistency rather than stressing over deep sleep percentages. If you wake up feeling clear and capable, an algorithmic score claiming poor deep sleep should not alter your daily plans. You can explore structured restorative sleep and recovery strategies to support your natural circadian rhythms.
Respiratory rate represents the number of breaths you take per minute. Wearables calculate this metric overnight by analyzing subtle variations in your pulse waveform and micro-movements of your chest.
Under normal conditions, nocturnal breathing rates remain stable. A validation study in the Journal of Medical Internet Research demonstrated that smartwatches measure nocturnal respiratory rate accurately in healthy individuals. A comprehensive review in Nature Medicine reported an average error margin of roughly one breath per minute during overnight tracking.
However, respiratory rate accuracy declines in individuals with severe obstructive sleep apnea. Research shows that device accuracy drops from over 90 percent in healthy populations to below 80 percent in patients with severe airway obstruction.
A sustained rise in nocturnal breathing rate can reflect fever, respiratory infection, high altitude exposure, or elevated ambient room temperature. Studies during the COVID-19 pandemic revealed that meaningful elevations in resting respiratory rate occurred in a subset of symptomatic individuals. Yet an elevated breathing rate remains a nonspecific signal that requires medical evaluation if accompanied by shortness of breath or persistent fever.
Managing physical development requires balancing mechanical work with internal biological strain. Training load falls into two distinct categories:
Commercial wearables combine heart rate data, activity duration, and proprietary formulas to generate a single training load score. These proprietary scores are not interchangeable across brands. A 500-point load score on one platform represents a completely different calculation than a similar number on a competing device.
Furthermore, heart-rate-based algorithms have blind spots. A heavy barbell squat session creates substantial muscular tension and joint stress, but produces a modest heart rate response. If you rely exclusively on your watch to calculate load, you will underestimate the systemic recovery required after heavy resistance training. You can consult dedicated guides on building physical capacity and strength to structure your lifting volume properly.
To use recovery metrics effectively, you must distinguish true physiological changes from random sensor error. Consumer devices operate under difficult conditions, collecting data from a moving wrist through variable skin contact.
Understanding measurement science prevents you from misinterpreting raw numbers. Four distinct concepts govern data quality:
A wearable can demonstrate excellent average agreement across a large study while still delivering an inaccurate reading for an individual user on a given morning. The INTERLIVE expert consensus established strict validation standards for consumer heart rate monitors. Their research underscores that sensor fit, skin pigmentation, ambient temperature, and movement all influence signal precision.
Optical sensors work by projecting light into capillary beds and measuring how that light scatters as blood pulses through the tissue. Any factor that disturbs this optical path introduces measurement artifacts:
A systematic review in the International Journal of Environmental Research and Public Health confirmed that wearable HRV accuracy is highest during motionless rest. As exercise intensity increases, the agreement between optical sensors and clinical ECG monitors declines significantly.
To collect reliable data, standardize your measurement routine. Measure your recovery metrics during overnight sleep or during a quiet five-minute resting period immediately upon waking. Never compare an active afternoon reading to an overnight baseline.
Population averages are meaningless for individual recovery decisions. A baseline resting heart rate of 48 beats per minute is normal for an endurance athlete, but could indicate bradycardia in a sedentary individual. An RMSSD value of 35 milliseconds might reflect deep recovery for a 55-year-old executive, while representing severe exhaustion for an elite collegiate swimmer.
You must build a personal baseline from three to four weeks of consistent, standardized tracking. Use a rolling median or standard deviation band rather than an arbitrary target number.
A practical baseline traffic-light system looks like this:
A meta-analysis in Sports Medicine evaluated HRV-guided training programs. The authors concluded that while tracking autonomic trends improves vagal tone, the performance advantages over standard, well-structured training programs are modest. Recovery metrics should guide minor daily adjustments rather than dictating your entire athletic schedule.
Applying recovery data requires adjusting your interpretation based on the specific physical demands of your lifestyle.
High altitude environments alter baseline cardiovascular and respiratory metrics. When you ascend into thin air, atmospheric pressure drops, reducing the oxygen available with each breath.
Your autonomic nervous system responds immediately by increasing your resting heart rate and respiratory rate to maintain tissue oxygenation. At the same time, heart rate variability drops as sympathetic drive increases.
If you interpret these numbers through a standard algorithm, your device will report severe physiological distress. In reality, these shifts represent normal biological acclimatization. When trekking at altitude, look for relative stabilization over three to four days at a constant elevation. A sudden, sharp spike in resting breathing rate accompanied by a headache or dizziness warrants immediate rest or descent.
Resistance training places unique demands on the human body that optical wearables struggle to measure. Heavy deadlifts, squats, and overhead presses strain connective tissues, deplete local glycogen stores, and tax the central nervous system.
Yet because the total cardiovascular duration is brief, your device may register low internal load. You might wake up the following morning with normal HRV and a low resting heart rate, while your prime movers remain severely fatigued.
Never use a green recovery score as permission to lift heavy when your joints ache and your movement patterns feel sluggish. Perceived muscle soreness, joint integrity, and movement quality must always take precedence over an optical heart rate score.
During high-volume endurance blocks, such as marathon training or long-distance cycling, recovery metrics behave differently. Prolonged aerobic training increases blood plasma volume and enhances parasympathetic tone.
In some cases, severe overreaching produces an abnormally high HRV combined with a suppressed resting heart rate. This phenomenon, known as parasympathetic hyperactivity, occurs when the autonomic system becomes blunted from chronic exhaustion. The athlete feels lethargic, heavy-legged, and incapable of reaching high training zones, despite an app displaying a peak readiness score.
If your legs feel unresponsive and you cannot elevate your heart rate during hard intervals, trust your physical sensation. Step back, reduce mileage, and allow systemic recovery to occur. You can review advanced research-backed longevity resources to understand how to balance endurance volume with long-term structural health.
Crossing multiple time zones disrupts your core circadian clocks, digestive timing, and sleep architecture. Wearable metrics consistently reflect this systemic disruption.
After a grueling thirty hour transit to Tokyo, I realized my old strategy of just powering through was no longer working. I felt foggy for three days. I started digging into circadian biology and realized that timing my light exposure and fasting during the flight could completely shift my recovery. Now, I never board a long haul flight without a precise schedule for when to eat and when to put on an eye mask. It is the difference between losing a week of your trip and hitting the ground running.
When analyzing recovery metrics during international travel, expect predictable data distortions:
Instead of stressing over poor travel scores, focus on practical circadian entrainment. Seek bright morning sunlight immediately upon waking, align your meals with the local clock, and keep workouts light until your metrics restabilize. Those interested in maintaining high physical capacity across demanding itineraries can review specialized guides on travel and active adventure performance.
Misinterpreting recovery metrics can lead to poor training decisions and unnecessary health anxiety. Correcting common misconceptions ensures that you use your data productively.
Many users assume that a higher HRV score is always better. While an upward trend often reflects improving aerobic fitness and low systemic stress, an unusually high spike can signal acute autonomic dysfunction.
Sudden, dramatic increases in HRV can occur alongside severe overtraining, acute illness, or deliberate deep breathing exercises before measurement. Breathing slowly at six breaths per minute artificially inflates vagal metrics without reflecting a true change in systemic recovery. Track your rolling average rather than chasing daily peak scores.
Worrying over nightly deep sleep or REM percentages is counterproductive. As clinical validation studies confirm, consumer wearables rely on movement and heart rate approximations that regularly misclassify sleep phases.
If your tracker reports thirty minutes of deep sleep but you wake feeling refreshed, alert, and capable, ignore the algorithm. Obsessing over stage percentages creates orthosomnia, a condition where anxiety over sleep tracking data disrupts natural sleep quality. Prioritize sleep duration, dark room temperatures, and consistent bedtimes instead.
Wearable devices have demonstrated real value in academic studies monitoring physiological changes before illness onset. Researchers have published findings showing that spikes in resting pulse and respiratory rate can detect viral infections prior to symptom manifestation.
However, research algorithms operating across thousands of participants do not make your smartwatch a diagnostic tool. An elevated breathing rate might result from a heavy late dinner, alcohol, a warm bedroom, or seasonal allergies. Never use wearable data to diagnose disease or dismiss genuine medical symptoms.
A single poor recovery score should rarely derail a well-planned day. Sensor misalignment, an odd sleeping posture, or a restless dream can produce an artificially low recovery score.
Look for multi-day trends before altering your schedule. If your metrics remain depressed for three consecutive mornings and you notice physical sluggishness, adjusting your training volume is sensible. A single isolated drop warrants simple awareness rather than an immediate rest day.
Collecting vast amounts of health data creates diminishing returns. A streamlined, disciplined approach provides actionable insights without dominating your attention.
You do not need to analyze dozens of complex graphs every morning. Focus on three primary indicators:
If all three indicators look normal, proceed with your scheduled training, work, or outdoor adventures. If two or more indicators show meaningful deviation, adjust your plan.
Rather than viewing daily recovery as a binary choice between resting and training hard, implement a graded response system:
This structured workflow keeps your training productive while respecting your body's physiological limits. You can explore our complete archive of practical biohacking resources to refine your personal longevity protocols.
The broader scientific community views consumer health wearables as powerful tools for behavioral awareness and population research, but emphasizes clear boundaries for individual use.
Leading exercise physiologists and cardiologists agree that optical sensors provide excellent baseline estimates for resting heart rate and total sleep duration. When tracked consistently under standardized conditions, these metrics offer valuable visibility into autonomic recovery and lifestyle stress.
However, researchers remain cautious regarding sleep staging accuracy, proprietary readiness formulas, and diagnostic claims. Independent validation studies repeatedly show that consumer algorithms struggle to separate deep sleep from light sleep, and cannot account for local muscular damage or psychological fatigue.
The consensus among health scientists is straightforward: use wearable data as supplementary feedback, prioritize your long-term baselines over daily scores, and let your real-world performance and physical symptoms guide your decisions.
Wearable technology offers remarkable insight into your physiology when used with perspective, discipline, and scientific clarity.
Stay connected for research and practical guidance on longevity, strength, recovery, energy and active living. New ideas to help you stay capable, curious and ready for more.


Explore practical guidance on strength, recovery, energy, travel and longevity for a life that stays active.
explore the Blog