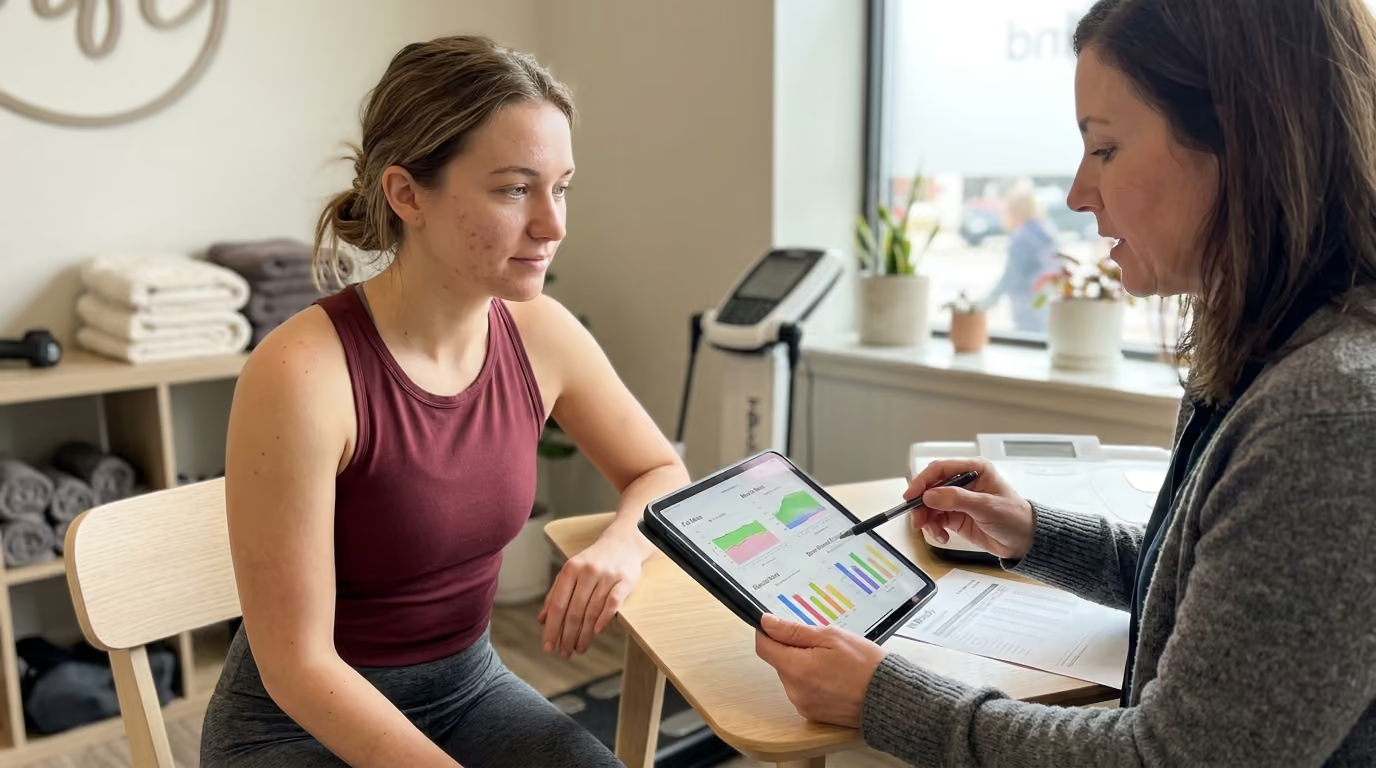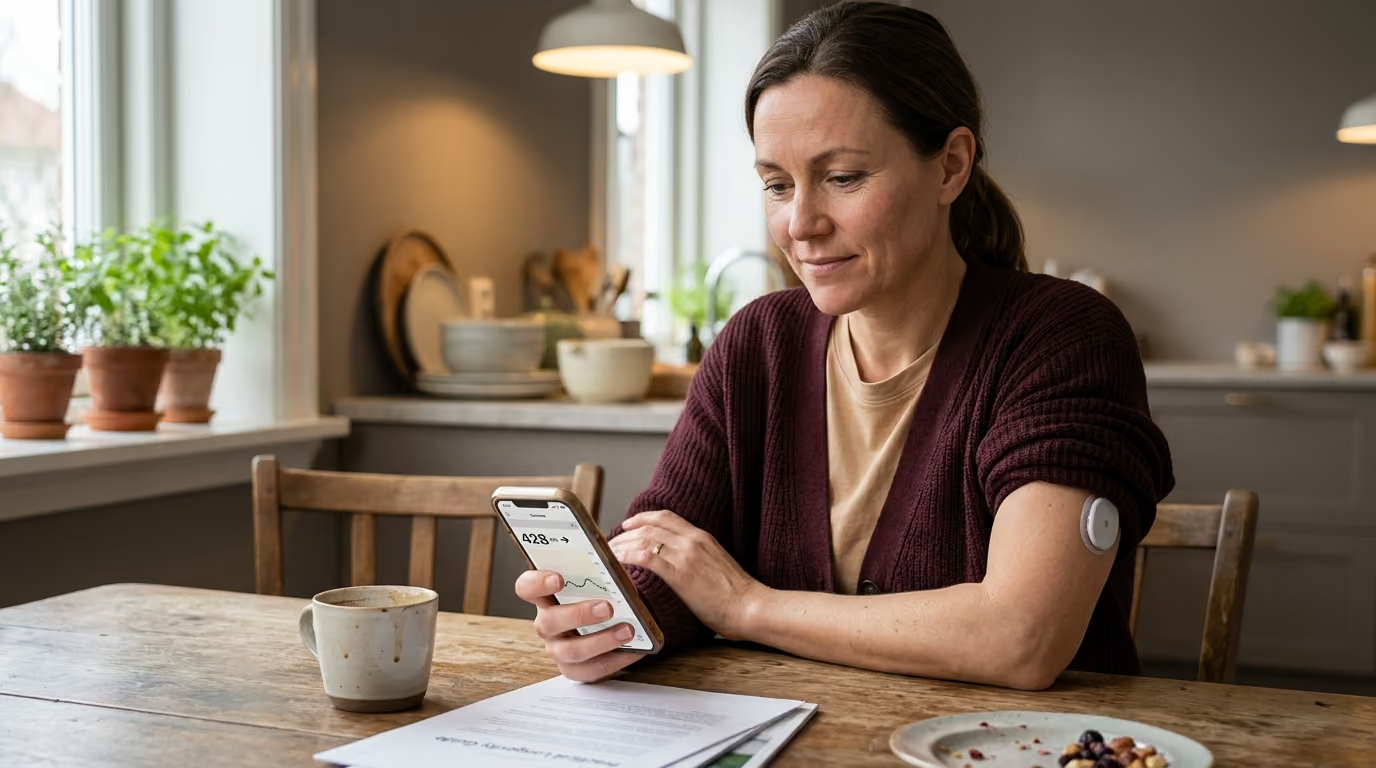

Continuous glucose monitors offer valuable metabolic insights for healthy adults, yet chasing flat lines often misinterprets natural variations and training.





You sit down at an outdoor café after a morning walk, order breakfast, and check your smartphone. A small sensor on the back of your arm transmits a real-time number to your screen. Ten minutes after finishing a bowl of steel-cut oats, you watch the line climb upward. You might immediately wonder if that grain bowl was a metabolic mistake, or if your body is simply doing what biology designed it to do.
Continuous glucose monitors, once reserved exclusively for managing type 1 and advanced type 2 diabetes, have entered mainstream longevity culture. Wearable biosensors offer an unfiltered view of how food, movement, stress, and sleep influence real-time physiology.
Yet real-time data without proper context creates confusion. An isolated spike on a smartphone screen does not mean you have damaged your arteries or derailed your health span. Used with discernment, a continuous glucose monitor is a remarkable educational tool that helps active adults understand their personal metabolism.
Continuous glucose monitoring provides a short-term window into how your daily routines influence interstitial glucose levels. For adults without diabetes, a sensor is an educational tool for personal behavioral experiments. It is not a validated longevity test, a general health score, or a replacement for clinical blood work.
The primary value of a sensor lies in revealing individual variation. Two adults can eat the exact same meal and produce completely different post-meal glucose responses. By observing these patterns, you can adjust meal composition, activity timing, and recovery habits to support daily energy and physical performance.
At the same time, glucose is only one variable in a complex metabolic system. A sensor cannot measure insulin, cannot diagnose metabolic disease on its own, and cannot rank the overall nutritional quality of your food. Current medical research does not show that healthy adults wearing continuous monitors reduce their long-term risk of heart disease or extend their lifespan.
Our objective is to use this technology to ask better questions rather than chase mathematically flat lines. The most effective approach combines glucose data with physical energy, appetite stability, and athletic performance. You can read our broader frameworks on nutrition and metabolism research to see how metabolic health fits into a complete longevity strategy.
To interpret glucose data accurately, you must first understand what the sensor actually measures. A wearable monitor does not sample capillary or venous blood like a traditional finger-prick meter. Instead, it places a tiny, flexible filament into the subcutaneous tissue just beneath your skin.
This filament measures glucose concentration in interstitial fluid, which is the liquid surrounding your body's cells. Glucose moves from your bloodstream into the interstitial fluid through capillaries. Because of this diffusion process, interstitial readings naturally lag behind direct blood glucose measurements by five to fifteen minutes.
This physiological lag is completely normal. During periods of rapid change, such as intense exercise or right after a high-carbohydrate meal, the sensor reading may differ temporarily from a blood test.
Glucose is reported in milligrams per deciliter (mg/dL) in the United States and millimoles per liter (mmol/L) in most other countries. A reading of 90 mg/dL equals 5.0 mmol/L, while 144 mg/dL equals 8.0 mmol/L. When tracking your numbers, look for recurring patterns across several days rather than fixating on a single point in time.
Understanding what happens to glucose inside a healthy body helps prevent unnecessary worry over everyday fluctuations. When you consume carbohydrates, your digestive system breaks them down into simple sugars, primarily glucose. This glucose enters the bloodstream through the intestinal wall, causing circulating levels to rise.
In response, the beta cells in your pancreas secrete insulin. Insulin acts like a key, signaling muscle, fat, and liver cells to absorb glucose from the blood for immediate energy or storage. Muscle tissue absorbs the vast majority of this circulating fuel, especially after physical exertion.
The liver acts as your central metabolic reservoir. Between meals and overnight, your liver continuously releases stored glucose into the blood through glycogenolysis and gluconeogenesis. This continuous release keeps your brain, red blood cells, and vital organs fueled while you sleep.
A post-meal glucose rise is a normal, healthy physiological response. When you eat, a temporary increase in glucose signals that your digestive system is functioning correctly. In healthy adults, glucose typically peaks within 45 to 60 minutes after a meal and returns toward pre-meal levels within two to three hours.
A glucose reading does not tell you how much insulin your pancreas had to produce to achieve that level. A person with high insulin sensitivity might clear a meal with a minimal release of insulin. Another person with early insulin resistance might maintain a similar glucose curve, but require four times as much insulin to do so. A wearable sensor measures glucose concentration, not your underlying insulin sensitivity.
One of the most valuable insights from metabolic research is that people process identical foods in remarkably diverse ways. Landmark research published by Zeevi and colleagues monitored 800 individuals across nearly 47,000 meals. The researchers documented vast differences in post-meal glucose curves among healthy adults eating identical foods.
One participant might eat a banana and experience a sharp, brief rise in glucose, while white bread produces a gentle curve. For another participant, the exact opposite occurs. These differences are driven by individual genetics, gut microbiome composition, baseline fitness, sleep history, and resting metabolic rate.
Population-level nutrition advice provides broad, useful baselines for public health. However, a personal glucose sensor allows you to test how your unique biology responds to specific meals.
This individual variability also highlights why borrowing another person's strict dietary rules is rarely effective. A meal that causes fatigue and a prolonged elevation in a friend might provide you with three hours of stable mental energy and physical stamina. Using a sensor as an educational tool helps you build a personal nutrition framework based on your own physiology.
For deeper insights into matching modern diagnostic tools with proven lifestyle habits, review our analysis in longevity and advanced biohacking.
If you decide to wear a sensor for two to four weeks, approach the experience like an investigator. Wandering through your day without a clear testing framework produces confusing data and unnecessary stress. A structured protocol produces clear, actionable insights that serve your health for years.
Begin by establishing a baseline. For the first three to five days, do not change your diet, exercise schedule, or daily routines. Log what you eat, when you train, how you sleep, and your subjective energy levels. This baseline establishes your typical daily range and highlights existing rhythms.
Once your baseline is established, begin running single-variable tests. Change only one factor at a time so you can clearly identify the cause of any difference in your glucose response.
Another practical test involves adjusting the physical structure of your meals. Compare how whole rolled oats affect your morning readings versus instant oats with identical macronutrient profiles. The intact fiber structure in less-processed foods slows gastric emptying, often producing a lower peak and a smoother return to baseline.
Always repeat an experiment at least twice before drawing conclusions. A single reading can be influenced by poor sleep, psychological stress, unseen dehydration, or subtle sensor noise. Consistency over time is the only reliable guide.
Physical activity changes how your body manages fuel. When skeletal muscle contracts, it activates a specialized transport protein called GLUT4. This transporter moves to the cell membrane and pulls glucose out of your bloodstream without requiring insulin.
This mechanism explains why a short walk after eating is exceptionally effective for smoothing out post-meal glucose. A ten to twenty minute walk after your largest meal helps your leg muscles clear glucose directly from circulation. This reduces both the peak excursion and the total insulin needed to handle the meal.
During strenuous workouts, your glucose dynamics look very different. During high-intensity intervals, heavy resistance training, or competitive sports, your sympathetic nervous system triggers the release of adrenaline and cortisol. These hormones instruct your liver to release stored glycogen into the bloodstream to ensure your working muscles never run out of fuel.
Watching your glucose rise to 150 or 170 mg/dL during a demanding set of front squats or a mountain sprint is completely normal. It is an adaptive, healthy response that demonstrates your liver can mobilize energy on demand. Do not avoid high-intensity workouts simply because they produce a temporary rise on your sensor screen.
For active adults who love alpine skiing, trail running, or backcountry hiking, glucose management directly influences stamina. During long days at altitude, cold exposure and sustained aerobic output increase total carbohydrate combustion.
If you notice your glucose drifting downward during prolonged mountain trekking, proactive fueling prevents physical bonking and mental fatigue. For comprehensive guides on building functional stamina, explore our articles on strength and physical performance.
When examining your daily data, look beyond the highest point on the graph. A single peak number provides very little insight without understanding the context of the curve.
Evaluating these patterns requires balance. A high peak with rapid clearance is often a sign of excellent insulin sensitivity. Conversely, a meal that stays elevated for four hours suggests your digestive tract is slowly processing a dense mix of fats and refined carbohydrates. Use these patterns to inform your meal timing rather than passing moral judgment on the food.
The rise of consumer health wearables has generated several widespread myths regarding blood sugar. Recognizing these misconceptions protects you from unnecessary worry and poor dietary choices.
The most common mistake is attempting to flatten the glucose line entirely. Some people eliminate all fruits, root vegetables, legumes, and whole grains because they cause visible excursions on their screens.
This approach often leads to poor athletic performance, chronic fatigue, low fiber intake, and social isolation. Your body is designed to process carbohydrates. A healthy metabolism is flexible, meaning it can handle incoming fuel, clear it efficiently, and return smoothly to baseline.
A sensor only measures glucose dynamics; it cannot evaluate overall nutritional value. A bowl of lentil soup with root vegetables will raise your glucose far more than deep-fried bacon. Yet the lentil soup delivers dietary fiber, plant polyphenols, minerals, and complex micronutrients that support long-term cardiovascular and gut health.
Never use a continuous glucose monitor as your sole metric for food quality. Glucose response must be balanced against nutrient density, satiety, and digestive tolerance.
Sensors are precision instruments, but they are not infallible. Sudden drops below 60 mg/dL during the night are frequently compression artifacts caused by rolling onto your arm.
If your sensor reads 55 mg/dL at 3:00 AM, but you feel completely fine, have no sweating, shaking, or heart palpitations, you are almost certainly experiencing a compression artifact. Always confirm unexpected or extreme numbers with a standard finger-stick blood meter before making medical decisions.
Tracking continuous biological data carries real psychological risks. When every meal is scored by an app, eating can quickly become a source of anxiety rather than nourishment and pleasure.
Research from University College London highlighted that using continuous monitors without diabetes can cause excessive worry about what is normal. The researchers noted that hyper-monitoring can lead to disordered eating patterns or orthorexia, where individuals develop an unhealthy obsession with eating only foods that produce a flat line.
A 2025 clinical study found that 68% of participants experienced anxiety about developing type 2 diabetes when faced with elevated glucose readings on consumer apps. People with a history of disordered eating or health anxiety should avoid using continuous monitors without direct medical supervision.
If wearing a sensor makes you feel fearful around food, remove it immediately. Health is built on physical resilience, emotional wellbeing, and freedom of movement, not obsessive vigilance over digital graphs.
A reader recently asked our team if they needed to adopt a complicated, three-hour morning routine they saw online. We told them absolutely not.
When we examined the research they referenced, the actual longevity benefits were marginal compared to simply getting eight hours of sleep and lifting heavy weights twice a week. It is incredibly easy to get distracted by the top one percent of biohacking optimization and forget that foundational habits deliver almost all of the real longevity gains.
You do not need to wear a glucose sensor for the rest of your life. For healthy adults, the minimal effective dose is a focused, two-to-four-week tracking sprint once every year or two. This brief window provides actionable insights into your baseline habits without creating long-term tracking fatigue.
To evaluate your habits efficiently, use a simple four-domain scorecard. Instead of judging a meal solely by its glucose peak, rate it across four balanced criteria:
Focus on one practical action at a time. Once you discover that a fifteen-minute post-dinner walk smooths your evening numbers and improves your sleep, make that your permanent habit. You can then remove the sensor and enjoy the benefits without further monitoring.
Metabolism is deeply connected to your internal circadian clock. Your body handles carbohydrates more efficiently in the morning and early afternoon, when insulin sensitivity naturally peaks. In the evening, as melatonin levels rise to prepare your brain for sleep, insulin sensitivity declines.
This circadian variation becomes obvious during long-haul international travel. Crossing multiple time zones disrupts your peripheral metabolic clocks in the liver, pancreas, and skeletal muscle. Sleep deprivation and irregular schedules temporarily reduce insulin sensitivity, causing meals to produce higher and more prolonged excursions than they would at home.
When traveling across time zones, align your meals with local daylight as quickly as possible. Avoid eating heavy, carbohydrate-dense meals during long overnight flights when your digestive tract expects to rest. Instead, prioritize light, protein-rich options until you arrive at your destination and see morning sunlight.
For practical frameworks on maintaining physical resilience while traveling the world, explore our resources on travel and adventure performance.
To support your body's restorative sleep rhythms across time zones, review our dedicated guides on recovery and sleep strategies.
While consumer continuous monitors are educational, they are not diagnostic medical devices. Certain patterns should prompt you to schedule formal laboratory testing with your physician.
A standard medical evaluation for metabolic health includes laboratory tests that provide a complete, validated picture of your physiology:
A wearable sensor can highlight interesting trends, but clinical blood tests remain the definitive standard for assessing longevity, cardiovascular risk, and metabolic health.
The broader medical and scientific consensus regarding continuous glucose monitoring in healthy populations is clear and balanced. Leading clinical endocrinology organizations and health authorities recognize that over-the-counter sensors offer safe educational insights for curious adults.
A 2024 meta-analysis of 25 randomized trials demonstrated that real-time glucose feedback can support modest improvements in overall blood sugar stability. However, these changes were not consistently linked to significant weight loss or reduced cardiovascular events.
Leading researchers emphasize that technology can never replace foundational health behaviors. Regular resistance training, adequate deep sleep, whole-food nutrition, stress management, and daily physical movement remain the proven drivers of long-term health span.
Review this guide whenever you plan to run a short-term tracking sprint, when your daily training load or diet changes significantly, or if you find yourself feeling anxious about normal post-meal fluctuations.
Sustainable longevity is built on physical capability, clear thinking, and the freedom to enjoy an active life without constant digital supervision.
Stay connected for research and practical guidance on longevity, strength, recovery, energy and active living. New ideas to help you stay capable, curious and ready for more.


Explore practical guidance on strength, recovery, energy, travel and longevity for a life that stays active.
explore the Blog