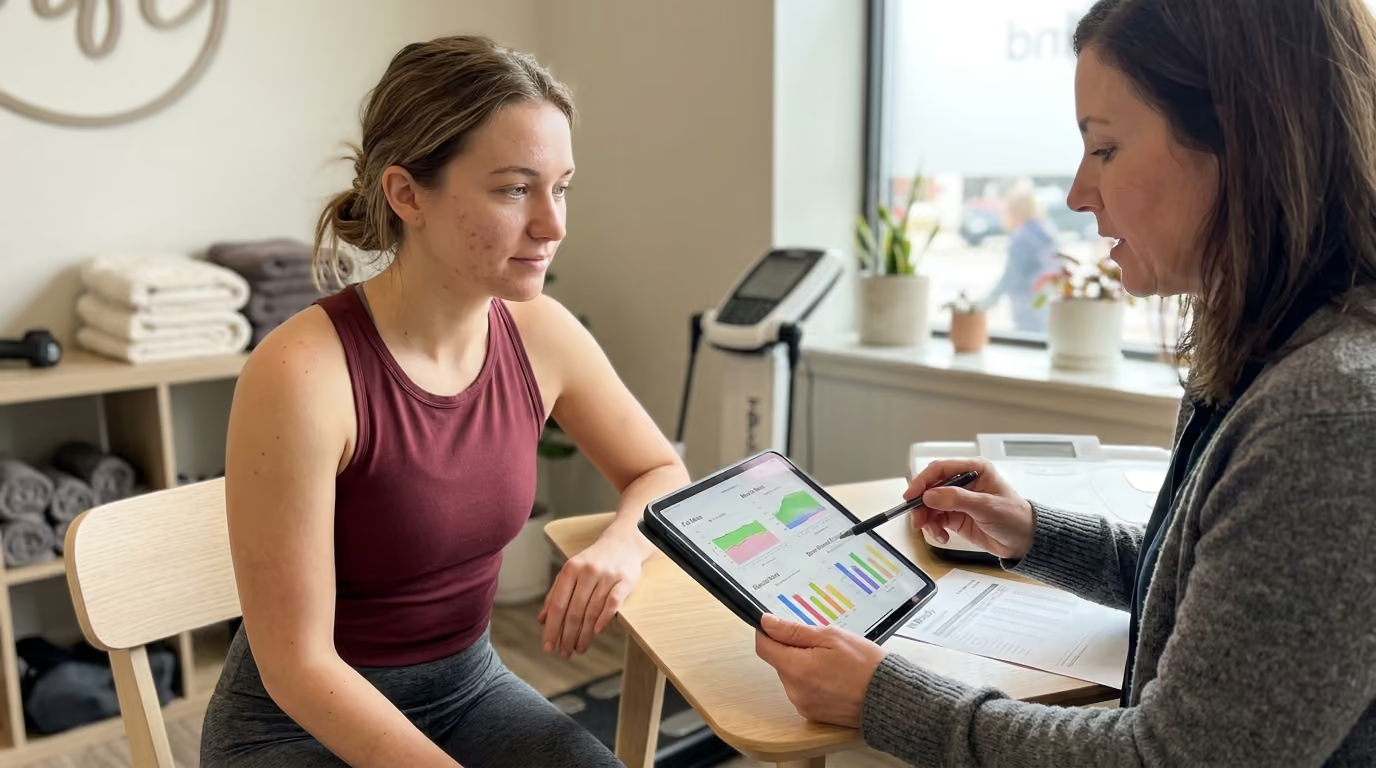

A personal longevity dashboard combines core cardiometabolic markers, lifestyle habits, objective physical capability tests.





You wake up after a long week of work and travel, look at your wrist, and notice three different readiness scores telling you conflicting stories. One app says your recovery is poor because your heart rate variability dropped slightly overnight. Another tells you your sleep quality was exceptional. A third demands that you log fifty distinct data points before your morning coffee.
Many active adults find themselves surrounded by numbers, charts, and alerts. Yet they remain uncertain about whether their physical capability, cardiovascular health, and day to day vitality are actually moving in the right direction.
A personal longevity dashboard is not a magic crystal ball that predicts your exact lifespan. Instead, it serves as a clean, structured decision support tool. It cuts through noise, helps you spot meaningful physiological trends, and connects daily habits to long term functional capability.
A reliable personal dashboard does not require dozens of exotic lab tests or nonstop biometric tracking. The scientific literature does not support a single, universally validated score that combines every variable of human biology into one neat number. Instead, the strongest evidence points toward a small core of validated domains: cardiometabolic health, foundational lifestyle behaviors, objective physical function, medical history, and subjective vitality.
Tracking these domains gives you actionable insight without creating unnecessary friction. Rather than obsessing over daily fluctuations, you establish personal baselines under repeatable conditions. You then apply clear decision rules to distinguish between normal biological variation and trends that require a deliberate shift in training, recovery, or medical care.
The primary goal is functional independence and robust physical performance across decades. By measuring what matters and ignoring what does not, you protect both your physical health and your mental peace. You can read more about practical tracking frameworks in our longevity and biohacking resource center.
To build a defensible dashboard, you must understand what the underlying longevity research actually measures. Scientific studies generally evaluate health through specific, bounded lenses rather than sweeping theories of biological age.
The American Heart Association established one of the clearest frameworks for long term health tracking with its Life's Essential 8 model. This framework evaluates eight core components divided into two equal categories. The first category covers health behaviors: diet quality, physical activity volume, nicotine exposure, and sleep health. The second category covers clinical health factors: body mass index, blood lipids, blood glucose, and blood pressure.
Research published by the American Heart Association demonstrates that individuals with higher scores across these eight metrics experience significantly lower cardiovascular mortality and greater overall healthspan. The framework scores each metric from 0 to 100 to produce an unweighted average. However, researchers emphasize that this composite score is a cardiovascular health construct. It is not an all-encompassing measurement of cognitive health, cancer risk, or muscular independence.
Physical function provides a second essential scientific pillar. While blood panels reveal internal metabolic and vascular health, physical capability tests evaluate the integrated performance of your neuromuscular, skeletal, and cardiopulmonary systems. A systematic review published in the British Medical Journal examined multiple prospective cohort studies and found that objective physical capability measures strongly predict all cause mortality in community dwelling adults.
Gait speed stands out as an exceptionally reliable functional biomarker. A pooled analysis of nine cohort studies following 34,485 adults aged 65 and older found that walking speed was consistently associated with survival. In that pooled analysis, each 0.1 meter per second increase in gait speed corresponded to a 12 percent reduction in mortality risk. The slowest walking speed quartile faced a pooled mortality hazard ratio of 2.87 compared to the fastest quartile after adjusting for age, sex, and body size.
Composite batteries like the Short Physical Performance Battery, known as the SPPB, also demonstrate robust prognostic value. Research pooling multiple clinical trials found that an SPPB score below 10 out of 12 predicted higher all cause mortality. A meta-analysis published in the Journal of the American Medical Directors Association revealed that adults scoring between 0 and 3 faced more than triple the mortality risk of those scoring between 10 and 12.
Observational data must be interpreted carefully. Walking faster or improving a chair rise score reflects a healthier physiological system, but forced speed alone does not automatically grant immunity from disease. These functional tests are reliable indicators of systemic reserve, functional reserve, and underlying physical resilience.
A comprehensive dashboard organizes your health data into five logical pillars. This structure ensures you do not over-index on lab results while ignoring how your body moves and feels.
Cardiometabolic markers evaluate the integrity of your blood vessels, heart, and energy processing pathways. These variables often change silently before any physical symptoms emerge.
Your daily routines dictate the vast majority of long term health outcomes. Tracking behaviors provides immediate feedback on the inputs that drive internal biomarkers.
To learn more about structuring sustainable daily habits, see our guide to longevity and living well.
Physical function tests assess your real world capacity to generate force, maintain balance, and move efficiently through space.
Data without clinical context leads to misinterpretation. Your dashboard must maintain a clean record of your unique medical background.
Biomarkers and wearable devices can miss subtle shifts in systemic well being. Your subjective experience provides essential qualitative signals.
Data is only valuable if it keeps you capable of enjoying the activities you love. Whether your passion is skiing in the Alps, hiking high mountain passes, or traveling across time zones, your dashboard should directly support real world adventures.
Consider a 52 year old executive who enjoys multi-day trekking in the Dolomites. A standard medical checkup might reveal that her cholesterol and fasting glucose are within normal limits. However, if her sit to stand power is declining and her grip strength has dropped over the past six months, her ability to handle steep descents with a loaded backpack is compromised.
By tracking physical capability alongside metabolic numbers, she can adjust her training before an adventure. She might introduce dedicated eccentric quad training, step ups, and loaded carries to rebuild lower body power.
Our team often encounters active adults who become overwhelmed by complicated protocols. A reader recently asked me if they needed to start a complicated, three hour morning routine they saw online. I told them absolutely not. When I looked at the research they referenced, the actual benefits were marginal compared to simply getting eight hours of sleep and lifting heavy things twice a week. It is incredibly easy to get distracted by the top one percent of optimization and forget that the foundation is where all the real longevity gains are made.
When your dashboard focuses on the fundamentals, you maintain the strength and energy required for demanding physical pursuits. You can read more about building functional resilience in our performance and fitness section.
A single test result is simply a snapshot vulnerable to stress, poor sleep, or dehydration. To make your dashboard useful, you must establish reliable baselines through standardized testing procedures.
Gait speed testing requires minimal equipment but demands strict consistency.
Find an unobstructed hallway or flat pathway at least six meters long. Measure a four meter course on the floor, marking the start line, the two meter acceleration point, and the finish line.
Walk at your normal, comfortable pace from the start line. Begin timing when your lead foot crosses the two meter acceleration mark, and stop timing when your lead foot crosses the finish line.
Perform the test three times during a two week baseline period. Use your standard walking shoes each time. Divide four meters by the recorded seconds to find your speed in meters per second, then record the average. A healthy baseline for active adults typically ranges between 1.1 and 1.4 meters per second.
The five times sit to stand test evaluates lower limb strength, speed, and functional motor control.
Use a sturdy, armless dining chair with a standard seat height of approximately 43 to 45 centimeters. Place the chair securely against a wall to prevent slipping.
Sit upright with your back against the backrest and your feet flat on the floor. Cross your arms over your chest so your hands touch your opposite shoulders.
On the command to start, stand up completely straight and sit down again five times as quickly as possible without using your arms. Stop the stopwatch the instant your buttocks touch the chair on the fifth repetition.
Complete this test twice during your baseline period, allowing two minutes of rest between trials. Record the fastest clean trial. Most healthy adults under 65 can complete this test in under ten seconds.
Balance declines gradually with age unless practiced deliberately.
Test your balance barefoot on a solid, non-slip floor near a wall or counter for safety.
First, test the tandem stance: place one foot directly in front of the other so the heel of the front foot touches the toes of the rear foot. Cross your arms over your chest and hold the position for thirty seconds without moving your feet.
Second, test the single leg stance: stand on one leg with your hands on your hips and lift the opposite foot off the ground without allowing your legs to touch. Time how long you can hold this position up to a maximum of thirty seconds per leg.
Repeat the test three times over two weeks to establish your personal average.
Grip strength serves as a practical proxy for total body muscular strength when measured correctly.
Use a calibrated isometric handgrip dynamometer. Adjust the handle so the middle joint of your fingers rests comfortably at a ninety degree angle against the lever.
Stand upright with your shoulders relaxed, your arm hanging naturally at your side, and your elbow bent at ninety degrees. Squeeze the handle with maximum effort for three to five seconds while exhaling smoothly.
Test each hand three times, alternating hands and resting for sixty seconds between attempts. Record the highest score for your dominant and non-dominant hands. Maintain the exact same posture, dynamometer model, and handle setting for all future quarterly tests.
To ensure your data remains valid over time, follow these five baseline rules:
A dashboard without decision rules creates confusion. When a metric changes, you need a clear framework that dictates whether you should ignore it, adjust your lifestyle, or consult a doctor.
We recommend a tiered decision system using three simple categories: Green, Amber, and Red.
Green indicates that your metrics are stable, your subjective vitality is high, and your functional capability remains within your established baseline range.
Green does not mean your body is invulnerable. It simply means your current exercise, nutrition, and recovery routines are working effectively. Continue your current plan without adding new interventions.
Amber applies when a metric shows a persistent negative trend over multiple weeks or when a functional test declines on two consecutive testing sessions.
When a metric turns Amber, do not panic. First, look for obvious lifestyle confounders such as acute illness, heavy alcohol intake, travel fatigue, or overtraining. If the decline persists after two weeks of focused recovery, introduce a specific lifestyle modification. If the metric fails to improve after six weeks of targeted effort, schedule an appointment with your healthcare provider to review the trend.
Red indicates acute, severe, or unexplained physiological disruptions that demand professional clinical evaluation.
Never use a personal dashboard to self-diagnose or delay necessary medical care. Red status means putting the dashboard aside and contacting a qualified medical professional immediately.
Health tracking can easily become counterproductive when applied incorrectly. Avoiding these common traps will save you time, money, and mental energy.
Human biology fluctuates naturally throughout the day. Your resting heart rate, blood pressure, and subjective energy shift in response to hydration, meals, ambient temperature, and emotional stress.
Treating a single high blood pressure reading or one poor sleep score as a sign of declining health is a mistake. Always look for multi-week rolling averages rather than reacting to isolated daily outliers.
Commercial algorithms frequently promise to condense your entire biological state into a single biological age number. These proprietary scores often change dramatically between different commercial vendors using the exact same blood sample.
No single number can accurately represent the distinct aging rates of your vascular system, brain, liver, kidneys, and musculoskeletal frame. Focus on transparent, validated physiological markers rather than proprietary black-box calculations.
Studies show that faster walkers live longer on average. However, simply forcing yourself to walk quickly for ten seconds will not alter your cellular biology.
Gait speed is a reflection of overall neuromuscular and cardiovascular health. To improve your gait speed meaningfully, you must build lower body power, improve joint mobility, and maintain aerobic fitness through comprehensive physical training.
Every data point on your dashboard must be tied to a specific lifestyle or clinical action. If you track a metric but have no clear mechanism to influence it, remove it from your dashboard. Tracking passive data points only increases cognitive clutter without improving your healthspan.
A major risk of self-tracking is the development of hyper-vigilance and health-related anxiety. When tracking becomes compulsive, the psychological distress can actively harm the cardiovascular and autonomic health you are trying to protect.
A systematic review examining 67 empirical studies on self-tracking and the Quantified Self movement revealed that collecting more data does not automatically lead to better health behaviors or improved longevity outcomes. In fact, research published in cognitive psychotherapy literature demonstrates that individuals with health anxiety frequently use monitoring as a form of reassurance seeking.
When an anxious person feels uncertain about their health, they check their heart rate, pulse oximeter, or recovery app. If the number looks good, they experience temporary relief. However, this relief is short lived, prompting more frequent checking throughout the day. If the number is slightly anomalous, their anxiety spikes, leading to catastrophic interpretations.
A review on the psychological aspects of wearable health technologies noted that susceptible individuals can develop obsessive symptom monitoring. In a propensity-score-matched study of 172 patients with atrial fibrillation, wearable device users reported significantly greater symptom preoccupation and anxiety regarding their treatment than non-users.
To protect yourself from compulsive tracking, implement these seven strict dashboard rules:
Active adults frequently push their bodies in demanding environments, from high altitude ski resorts to multi-week international expeditions. Travel introduces acute physiological stressors that can distort your dashboard metrics if you do not account for them.
Crossing multiple time zones disrupts your circadian rhythm, temporarily elevating resting heart rate and depressing heart rate variability. Dehydration from dry cabin air and long hours of sitting can temporarily increase resting blood pressure. High altitude exposure naturally lowers oxygen saturation and increases resting respiratory rate.
When you are traveling, switch your dashboard into travel mode. Suspend formal baseline comparisons during trips and for five days after returning home. Use this transition period to focus entirely on foundational recovery habits.
Prioritize morning sunlight exposure in your new time zone, stay rigorously hydrated, and maintain consistent meal timing to reset your central clock. To read more about managing travel fatigue, review our resources on recovery and regeneration.
Before departing on a physically demanding adventure, run a simple functional readiness check four weeks in advance. Assess your single leg balance, five times sit to stand speed, and continuous walking endurance.
If your functional scores match your established baselines, you can step onto the mountain trail, ski slope, or dive boat with confidence in your physical capabilities. Learn more about maintaining high performance on expeditions in our travel and adventure section.
You do not need a complex spreadsheet with dozens of tabs to maintain an elite longevity dashboard. The most effective dashboard is minimal, elegant, and sustainable across decades.
Here is a practical twelve field dashboard layout that captures the highest yield metrics across your lifespan:
This compact framework covers all critical health domains while requiring less than ten minutes of total administrative time each week.
The broader medical and scientific community agrees that human longevity is primarily governed by cardiovascular health, metabolic regulation, functional strength, and basic lifestyle habits.
Cardiologists, geriatricians, and exercise scientists consistently emphasize that no commercial wearable device can replace standard clinical preventive screenings. Blood pressure management, smoking cessation, regular physical exercise, and a nutrient dense diet remain the undisputed pillars of long term physical capability.
Furthermore, clinical experts agree that physical capability tests, such as walking speed, chair rise ability, and balance, are some of the most reliable predictors of functional independence in later decades. Maintaining these physical attributes ensures that you can continue traveling, playing sports, and living autonomously well into your eighties and nineties.
Whenever you evaluate a new health metric or technology, test it against three fundamental questions:
If you cannot provide clear, evidence-based answers to all three questions, the metric does not belong on your dashboard. Discard the unnecessary noise and keep your attention focused on the core fundamentals that build genuine longevity.
Revisit this dashboard guide once a year before your annual physical examination, whenever you acquire a new health tracking tool, or if you notice yourself feeling anxious about your daily health metrics.
By grounding your health monitoring in validated science and practical decision rules, you can maintain peak physical capability, sharp mental clarity, and adventurous independence across every decade of your life.
Stay connected for research and practical guidance on longevity, strength, recovery, energy and active living. New ideas to help you stay capable, curious and ready for more.


Explore practical guidance on strength, recovery, energy, travel and longevity for a life that stays active.
explore the Blog